Data Science
Ed Tech data:
I’ve always been fascinated by the power of data in guiding our decisions. I was interested in finding out how my school, which now I was a staff member of, was collecting, processing, and using data. It wasn’t surprising that after a couple of months in my position, I’d start analyzing all the data I could get my hands on.
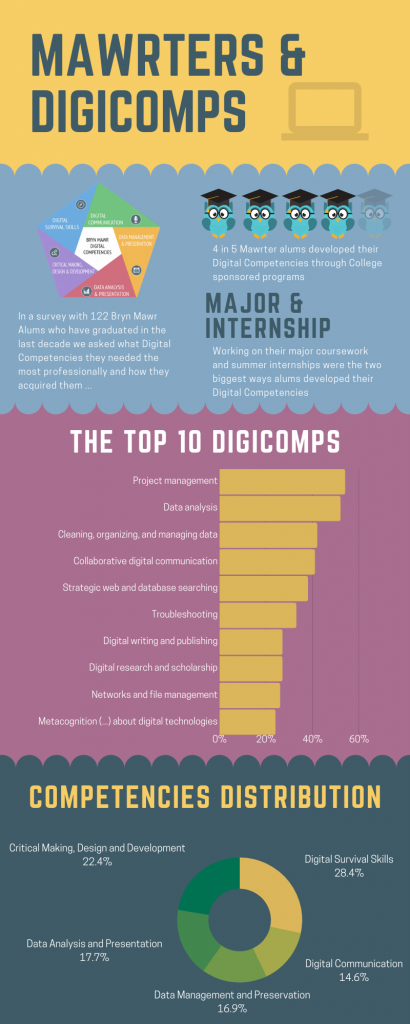
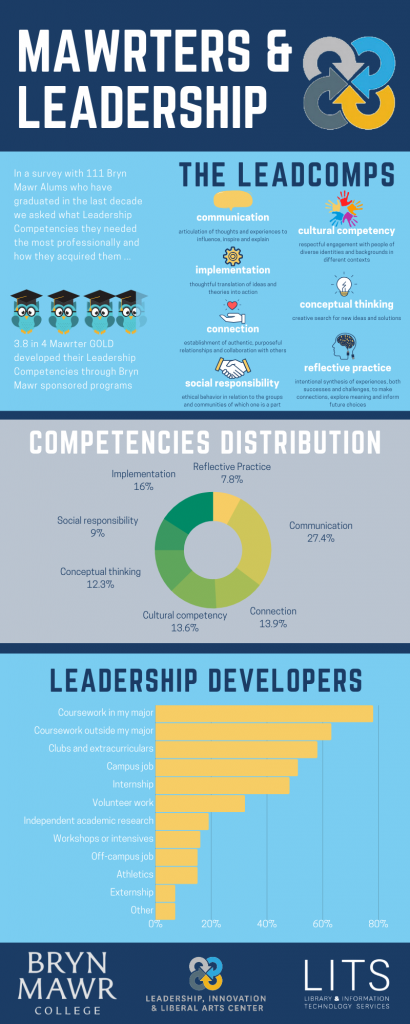
I’ve created those two infographics from a small survey (that predated my arrival to my position). We survey 122 graduates of the last decade (only 111 responded to both parts – which is why the numbers of respondents differ in both pictures). We asked questions regarding two different frameworks championed by Bryn Mawr College: The Digital Competencies and the Leadership Competencies.
We’ve used those infographics to help guide our programming and inform our community (especially our students) regarding important competencies in the workplace!
Digital Scholarship RA & Fellowship
In 2017, Bryn Mawr College launched the Digital Fellowship and Digital Scholarship Research Assistantship programs. I was chosen for both and worked closely with Physical Computing and Data Visualization during the Spring and Summer, respectively. My year-long fellowship/assistantship culminated in two projects “Shine Your Class Colors” and “College Women Visualization” (and a plethora of lessons learned!).
College Women Data Viz:
College Women is a consortial project of the libraries and archives of the Seven Sisters. Bryn Mawr played an essential role in getting the project started, so the fellows were given the task to create a “new way” to visualize and navigate College Women (on our website).
I designed a responsive WordCloud based on the available Metadata. Here is a prototype of what it looked like:
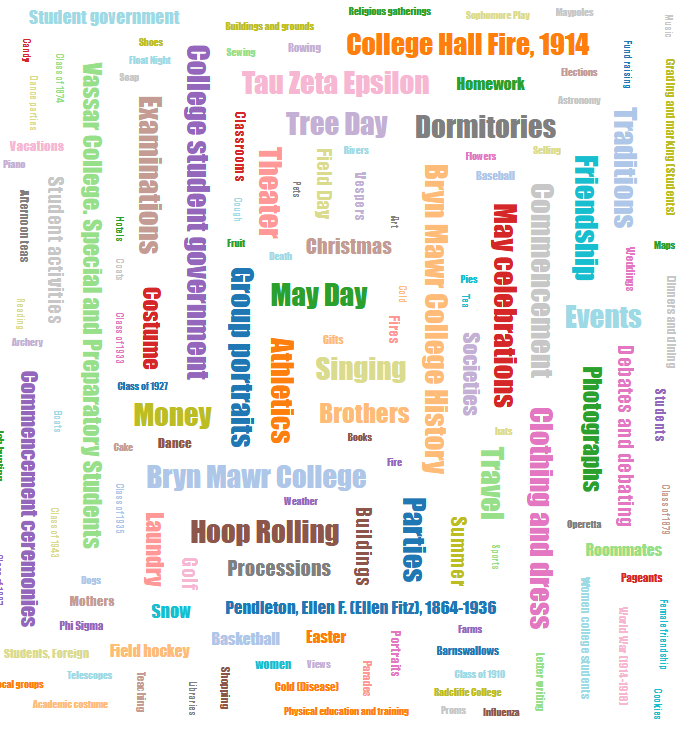
For accessibility purposes (and due to time constraints), we decided to make a weighted timeline instead, that when clicked would display an unweighted word cloud for that year. I was the Data Specialist from the group and was responsible for metadata extraction, cleansing, and display.
Check out college women data-viz here!
Shine Your Class Colors
After a semester exploring Arduino’s and Raspberry Pis with the other Research Assistants, I decided to challenge myself and try to ‘code’ a twitter box, which ended up becoming the groups’ project. Together we integrated that Twitter box into one of our college Traditions. One of our lanterns would display one of our class colors (Dark Blue, Red, Purple, Light Blue,